> ## Documentation Index
> Fetch the complete documentation index at: https://openrouter.ai/docs/llms.txt
> Use this file to discover all available pages before exploring further.
# Elastic Observability
> Send traces to Elastic Observability
[Elastic Observability](https://www.elastic.co/observability) stores and analyzes logs, metrics, and traces in Elasticsearch. OpenRouter sends traces to Elastic as OTLP HTTP/JSON with [OpenTelemetry GenAI](https://opentelemetry.io/docs/specs/semconv/gen-ai/) attributes, which Elastic's [LLM observability](https://www.elastic.co/docs/solutions/observability/applications/llm-observability) views use.
Broadcast sends traces only. It doesn't send logs or metrics.
## Step 1: Get your Elastic endpoint and API key
OpenRouter sends traces to the Elastic Cloud Managed OTLP endpoint, which is available on Elastic Cloud Serverless and Elastic Cloud Hosted. The endpoint looks like `https://.ingest...elastic.cloud:443` and uses an Elastic API key. APM Server and Integrations Server aren't supported, because they don't accept OTLP/HTTP JSON.
### Find your OTLP endpoint
1. In Kibana, go to **Add data** > **Application** > **OpenTelemetry**.
2. Copy the OTLP endpoint URL that Elastic shows for your deployment or project.
For more detail, see Elastic's [Managed OTLP endpoint documentation](https://www.elastic.co/docs/reference/opentelemetry/motlp).
### Create an API key
1. In Kibana, go to **Stack Management** > **API keys**, or create the key from the OpenTelemetry onboarding page.
2. Create an API key that can write trace data.
3. Copy the encoded API key.
See Elastic's [API key documentation](https://www.elastic.co/docs/deploy-manage/api-keys/elasticsearch-api-keys) for the required privileges.
## Step 2: Enable Broadcast in OpenRouter
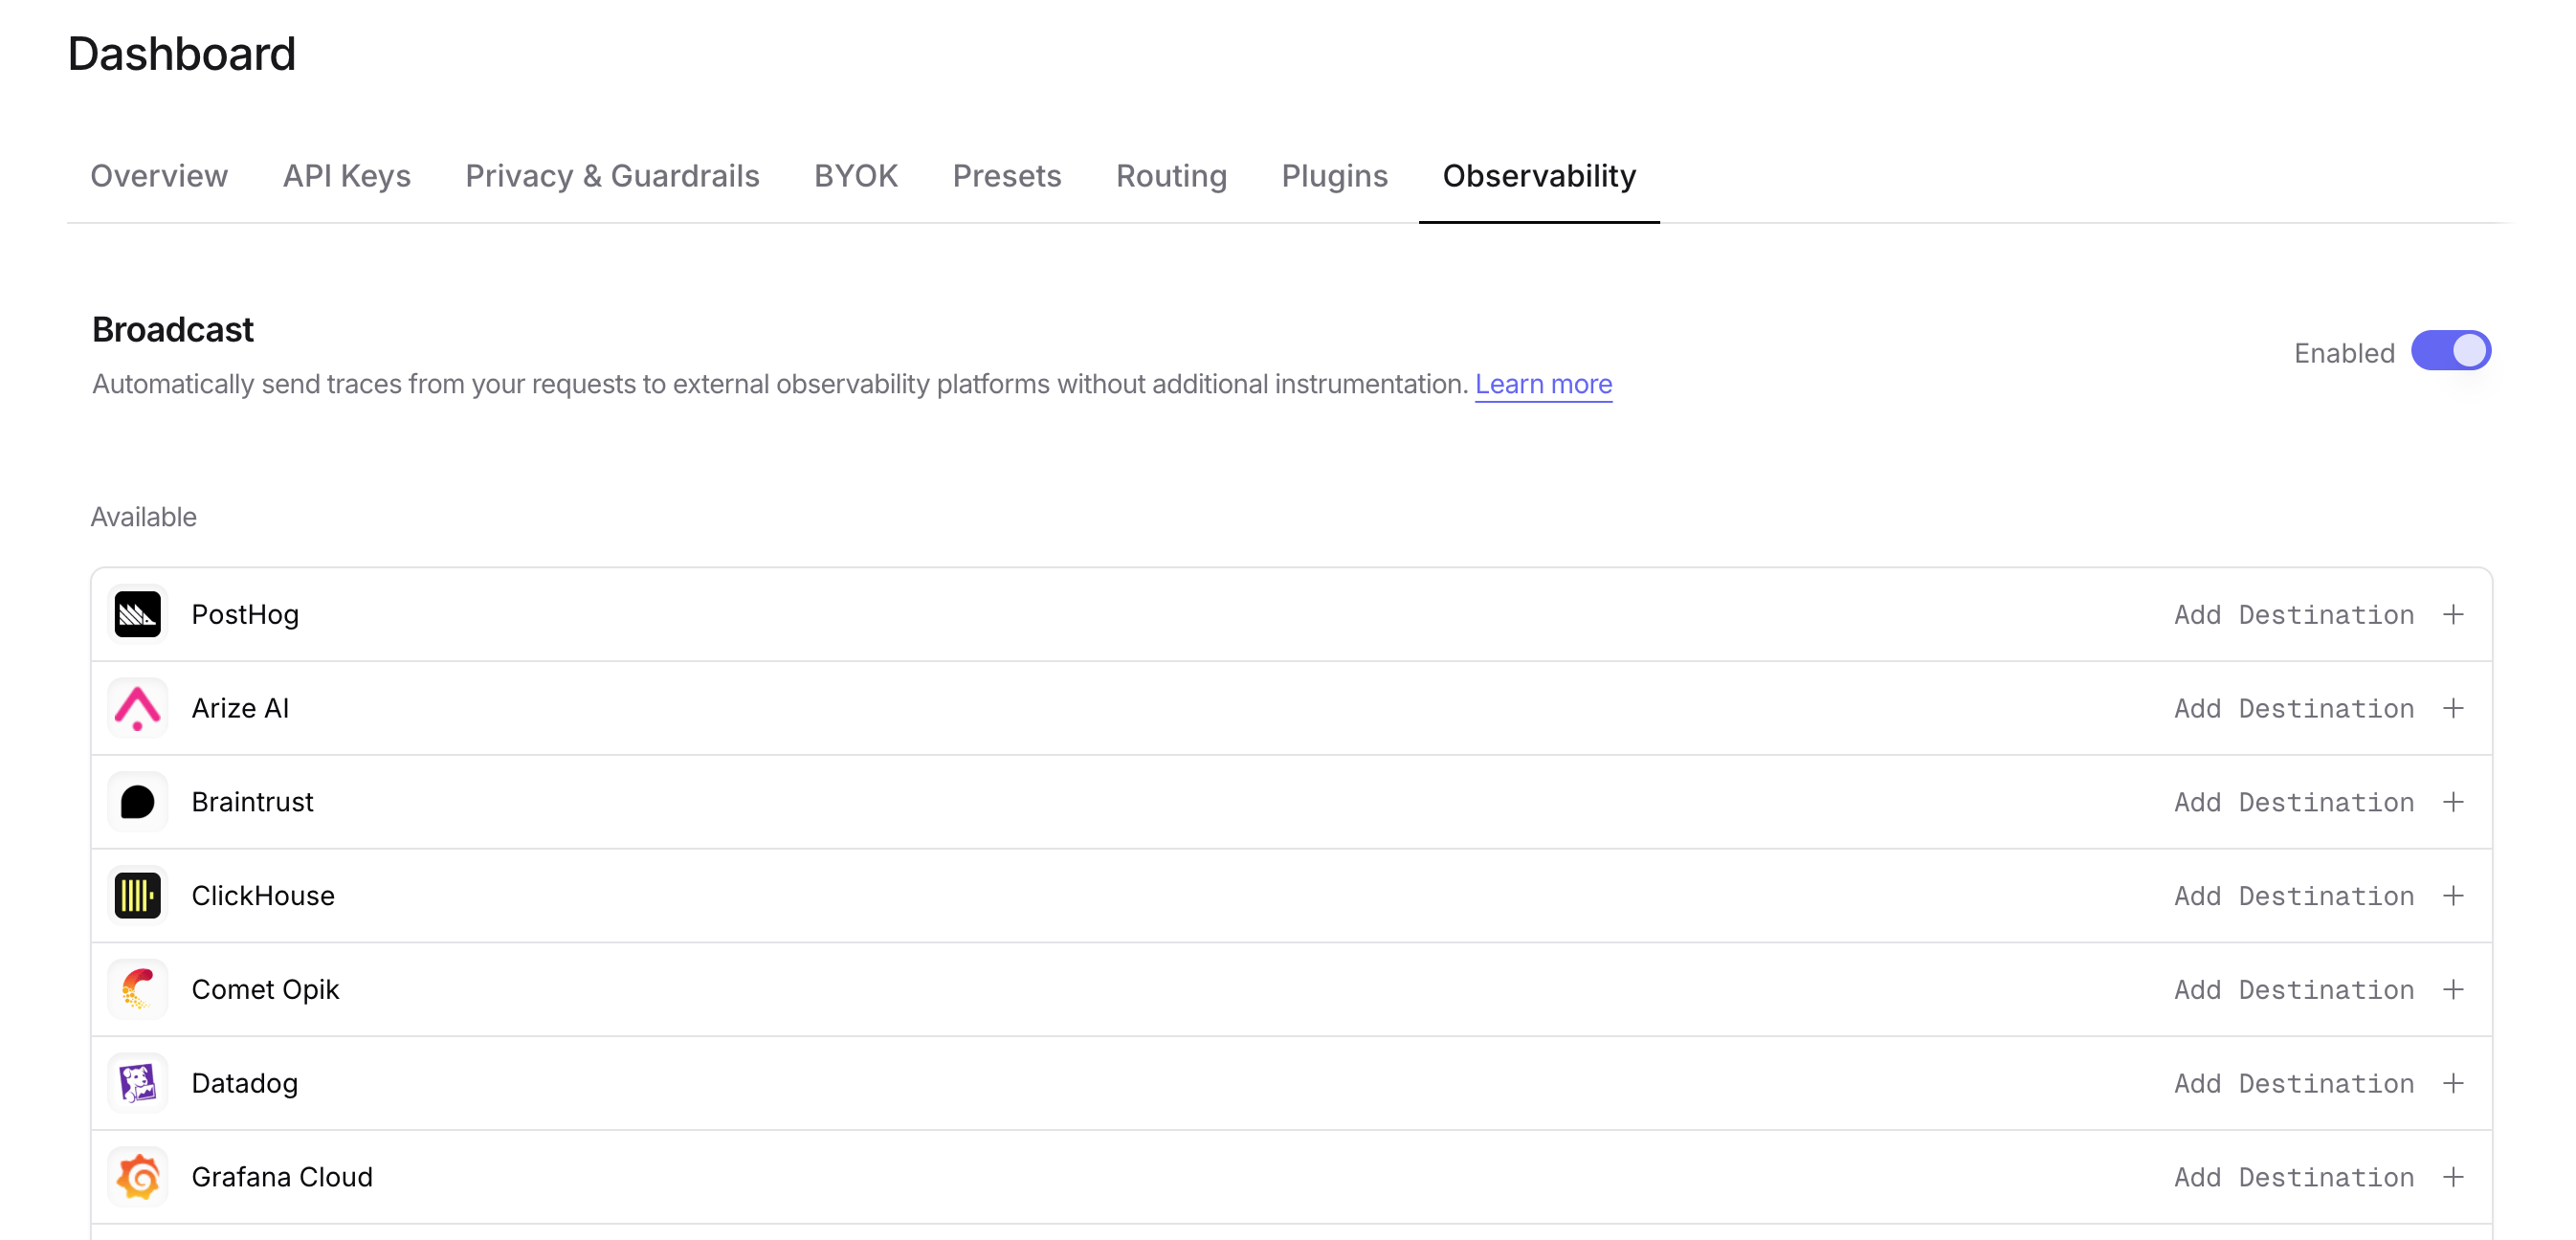
Go to [Settings > Observability](https://openrouter.ai/settings/observability) and toggle **Enable Broadcast**.
 ## Step 3: Configure Elastic Observability
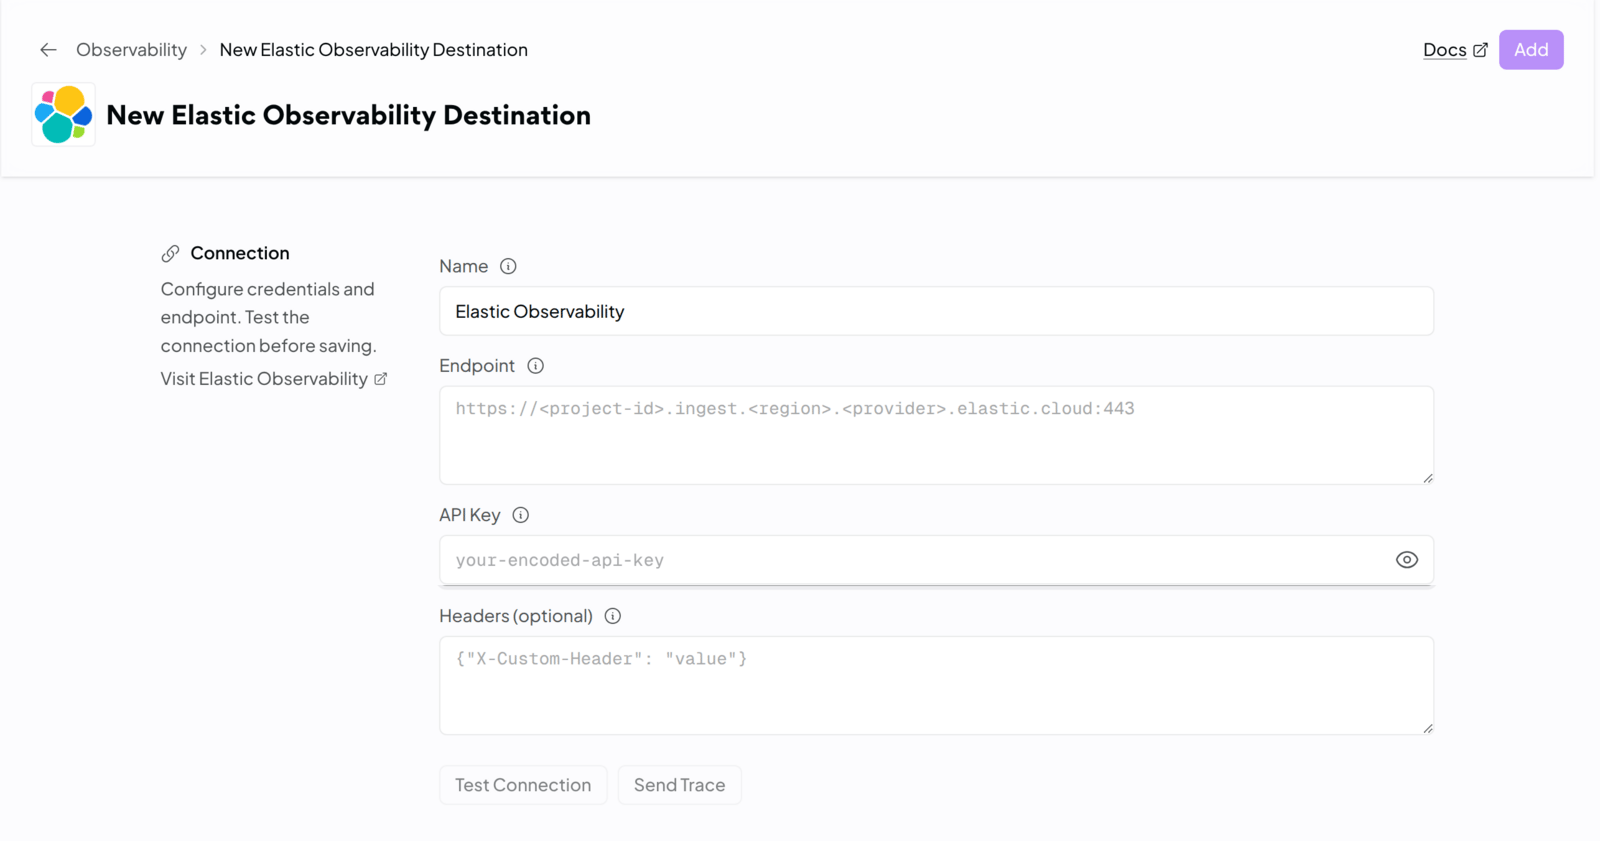
Click the edit icon next to **Elastic Observability** and enter:
* **Endpoint**: Your Elastic OTLP endpoint. OpenRouter appends `/v1/traces` for you, so enter the base URL. An endpoint that already ends in `/v1` or `/v1/traces` also works.
* **API Key**: Your encoded Elastic API key. OpenRouter sends it as `Authorization: ApiKey `.
* **Headers** (optional): Extra HTTP headers as JSON, for example `{"X-Custom-Header": "value"}`. Custom headers can't override `Authorization` or `Content-Type`.
## Step 3: Configure Elastic Observability
Click the edit icon next to **Elastic Observability** and enter:
* **Endpoint**: Your Elastic OTLP endpoint. OpenRouter appends `/v1/traces` for you, so enter the base URL. An endpoint that already ends in `/v1` or `/v1/traces` also works.
* **API Key**: Your encoded Elastic API key. OpenRouter sends it as `Authorization: ApiKey `.
* **Headers** (optional): Extra HTTP headers as JSON, for example `{"X-Custom-Header": "value"}`. Custom headers can't override `Authorization` or `Content-Type`.
 ## Step 4: Test and save
Click **Test Connection** to verify the setup. The configuration only saves if the test passes. A `401` means Elastic rejected the API key.
## Step 5: Send a test trace
Make an API request through OpenRouter, then find the trace in Elastic.
## Viewing your traces
Elastic stores OpenRouter spans in the `traces-generic.otel-default` data stream with the service name `openrouter`.
* **Applications**: In Kibana, open **Observability** > **Applications** > **Service inventory** and select the `openrouter` service.
* **Discover**: Open **Discover**, pick a data view that covers `traces-*`, and search for a generation ID. For example:
```text lines theme={null}
attributes.gen_ai.response.id : "gen-1234567890-abcdefghijklmnop"
```
## Trace attributes
OpenRouter traces include the following key attributes:
### Resource attributes
* `service.name`: Always `openrouter`
* `openrouter.trace.id`: The OpenRouter trace ID
### Span attributes
* `gen_ai.operation.name`: The operation type (for example, `chat`)
* `gen_ai.system`: The AI provider (for example, `openai`)
* `gen_ai.request.model`: The requested model
* `gen_ai.response.model`: The model that served the request
* `gen_ai.response.id`: The OpenRouter generation ID
* `gen_ai.usage.input_tokens`: Number of input tokens
* `gen_ai.usage.output_tokens`: Number of output tokens
* `gen_ai.usage.total_tokens`: Total tokens used
* `gen_ai.response.finish_reason`: Why the generation ended (for example, `stop`)
## Custom Metadata
Custom metadata from the `trace` field is sent as span attributes under the `trace.metadata.*` namespace, so you can filter on it in Discover.
### Supported Metadata Keys
| Key | Elastic mapping | Description |
| - | - | - |
| `trace_id` | Trace ID | Group multiple requests into a single trace |
| `trace_name` | Span name | Custom name for the root span |
| `span_name` | Span name | Name for intermediate spans in the hierarchy |
| `generation_name` | Span name | Name for the LLM generation span |
| `parent_span_id` | Parent span ID | Link to an existing span in your trace hierarchy |
### Example
```json lines theme={null}
{
"model": "openai/gpt-4o",
"messages": [{ "role": "user", "content": "Summarize this incident..." }],
"user": "user_12345",
"session_id": "session_abc",
"trace": {
"trace_name": "Incident Summary",
"generation_name": "Summarize",
"environment": "production"
}
}
```
### Additional Context
* The `user` field maps to `user.id` in span attributes.
* The `session_id` field maps to `session.id` in span attributes.
## Troubleshooting
### Test Connection fails with 401
Elastic rejected the credentials. Check that the API key is the encoded value and that it can write trace data.
### Traces don't appear
1. **Check the time range**: Widen the Kibana time picker to include the request time.
2. **Check the endpoint**: Use the OTLP endpoint from the OpenTelemetry onboarding page, not your Kibana or Elasticsearch URL.
## Additional resources
* [Elastic Managed OTLP endpoint](https://www.elastic.co/docs/reference/opentelemetry/motlp)
* [Elastic LLM observability](https://www.elastic.co/docs/solutions/observability/applications/llm-observability)
* [Elastic API keys](https://www.elastic.co/docs/deploy-manage/api-keys/elasticsearch-api-keys)
## Privacy Mode
When [Privacy Mode](/docs/guides/features/broadcast#privacy-mode) is enabled for this destination, prompt and completion content is excluded from traces. All other trace data — token usage, costs, timing, model information, and custom metadata — is still sent normally. See [Privacy Mode](/docs/guides/features/broadcast#privacy-mode) for details.
## Step 4: Test and save
Click **Test Connection** to verify the setup. The configuration only saves if the test passes. A `401` means Elastic rejected the API key.
## Step 5: Send a test trace
Make an API request through OpenRouter, then find the trace in Elastic.
## Viewing your traces
Elastic stores OpenRouter spans in the `traces-generic.otel-default` data stream with the service name `openrouter`.
* **Applications**: In Kibana, open **Observability** > **Applications** > **Service inventory** and select the `openrouter` service.
* **Discover**: Open **Discover**, pick a data view that covers `traces-*`, and search for a generation ID. For example:
```text lines theme={null}
attributes.gen_ai.response.id : "gen-1234567890-abcdefghijklmnop"
```
## Trace attributes
OpenRouter traces include the following key attributes:
### Resource attributes
* `service.name`: Always `openrouter`
* `openrouter.trace.id`: The OpenRouter trace ID
### Span attributes
* `gen_ai.operation.name`: The operation type (for example, `chat`)
* `gen_ai.system`: The AI provider (for example, `openai`)
* `gen_ai.request.model`: The requested model
* `gen_ai.response.model`: The model that served the request
* `gen_ai.response.id`: The OpenRouter generation ID
* `gen_ai.usage.input_tokens`: Number of input tokens
* `gen_ai.usage.output_tokens`: Number of output tokens
* `gen_ai.usage.total_tokens`: Total tokens used
* `gen_ai.response.finish_reason`: Why the generation ended (for example, `stop`)
## Custom Metadata
Custom metadata from the `trace` field is sent as span attributes under the `trace.metadata.*` namespace, so you can filter on it in Discover.
### Supported Metadata Keys
| Key | Elastic mapping | Description |
| - | - | - |
| `trace_id` | Trace ID | Group multiple requests into a single trace |
| `trace_name` | Span name | Custom name for the root span |
| `span_name` | Span name | Name for intermediate spans in the hierarchy |
| `generation_name` | Span name | Name for the LLM generation span |
| `parent_span_id` | Parent span ID | Link to an existing span in your trace hierarchy |
### Example
```json lines theme={null}
{
"model": "openai/gpt-4o",
"messages": [{ "role": "user", "content": "Summarize this incident..." }],
"user": "user_12345",
"session_id": "session_abc",
"trace": {
"trace_name": "Incident Summary",
"generation_name": "Summarize",
"environment": "production"
}
}
```
### Additional Context
* The `user` field maps to `user.id` in span attributes.
* The `session_id` field maps to `session.id` in span attributes.
## Troubleshooting
### Test Connection fails with 401
Elastic rejected the credentials. Check that the API key is the encoded value and that it can write trace data.
### Traces don't appear
1. **Check the time range**: Widen the Kibana time picker to include the request time.
2. **Check the endpoint**: Use the OTLP endpoint from the OpenTelemetry onboarding page, not your Kibana or Elasticsearch URL.
## Additional resources
* [Elastic Managed OTLP endpoint](https://www.elastic.co/docs/reference/opentelemetry/motlp)
* [Elastic LLM observability](https://www.elastic.co/docs/solutions/observability/applications/llm-observability)
* [Elastic API keys](https://www.elastic.co/docs/deploy-manage/api-keys/elasticsearch-api-keys)
## Privacy Mode
When [Privacy Mode](/docs/guides/features/broadcast#privacy-mode) is enabled for this destination, prompt and completion content is excluded from traces. All other trace data — token usage, costs, timing, model information, and custom metadata — is still sent normally. See [Privacy Mode](/docs/guides/features/broadcast#privacy-mode) for details.